1
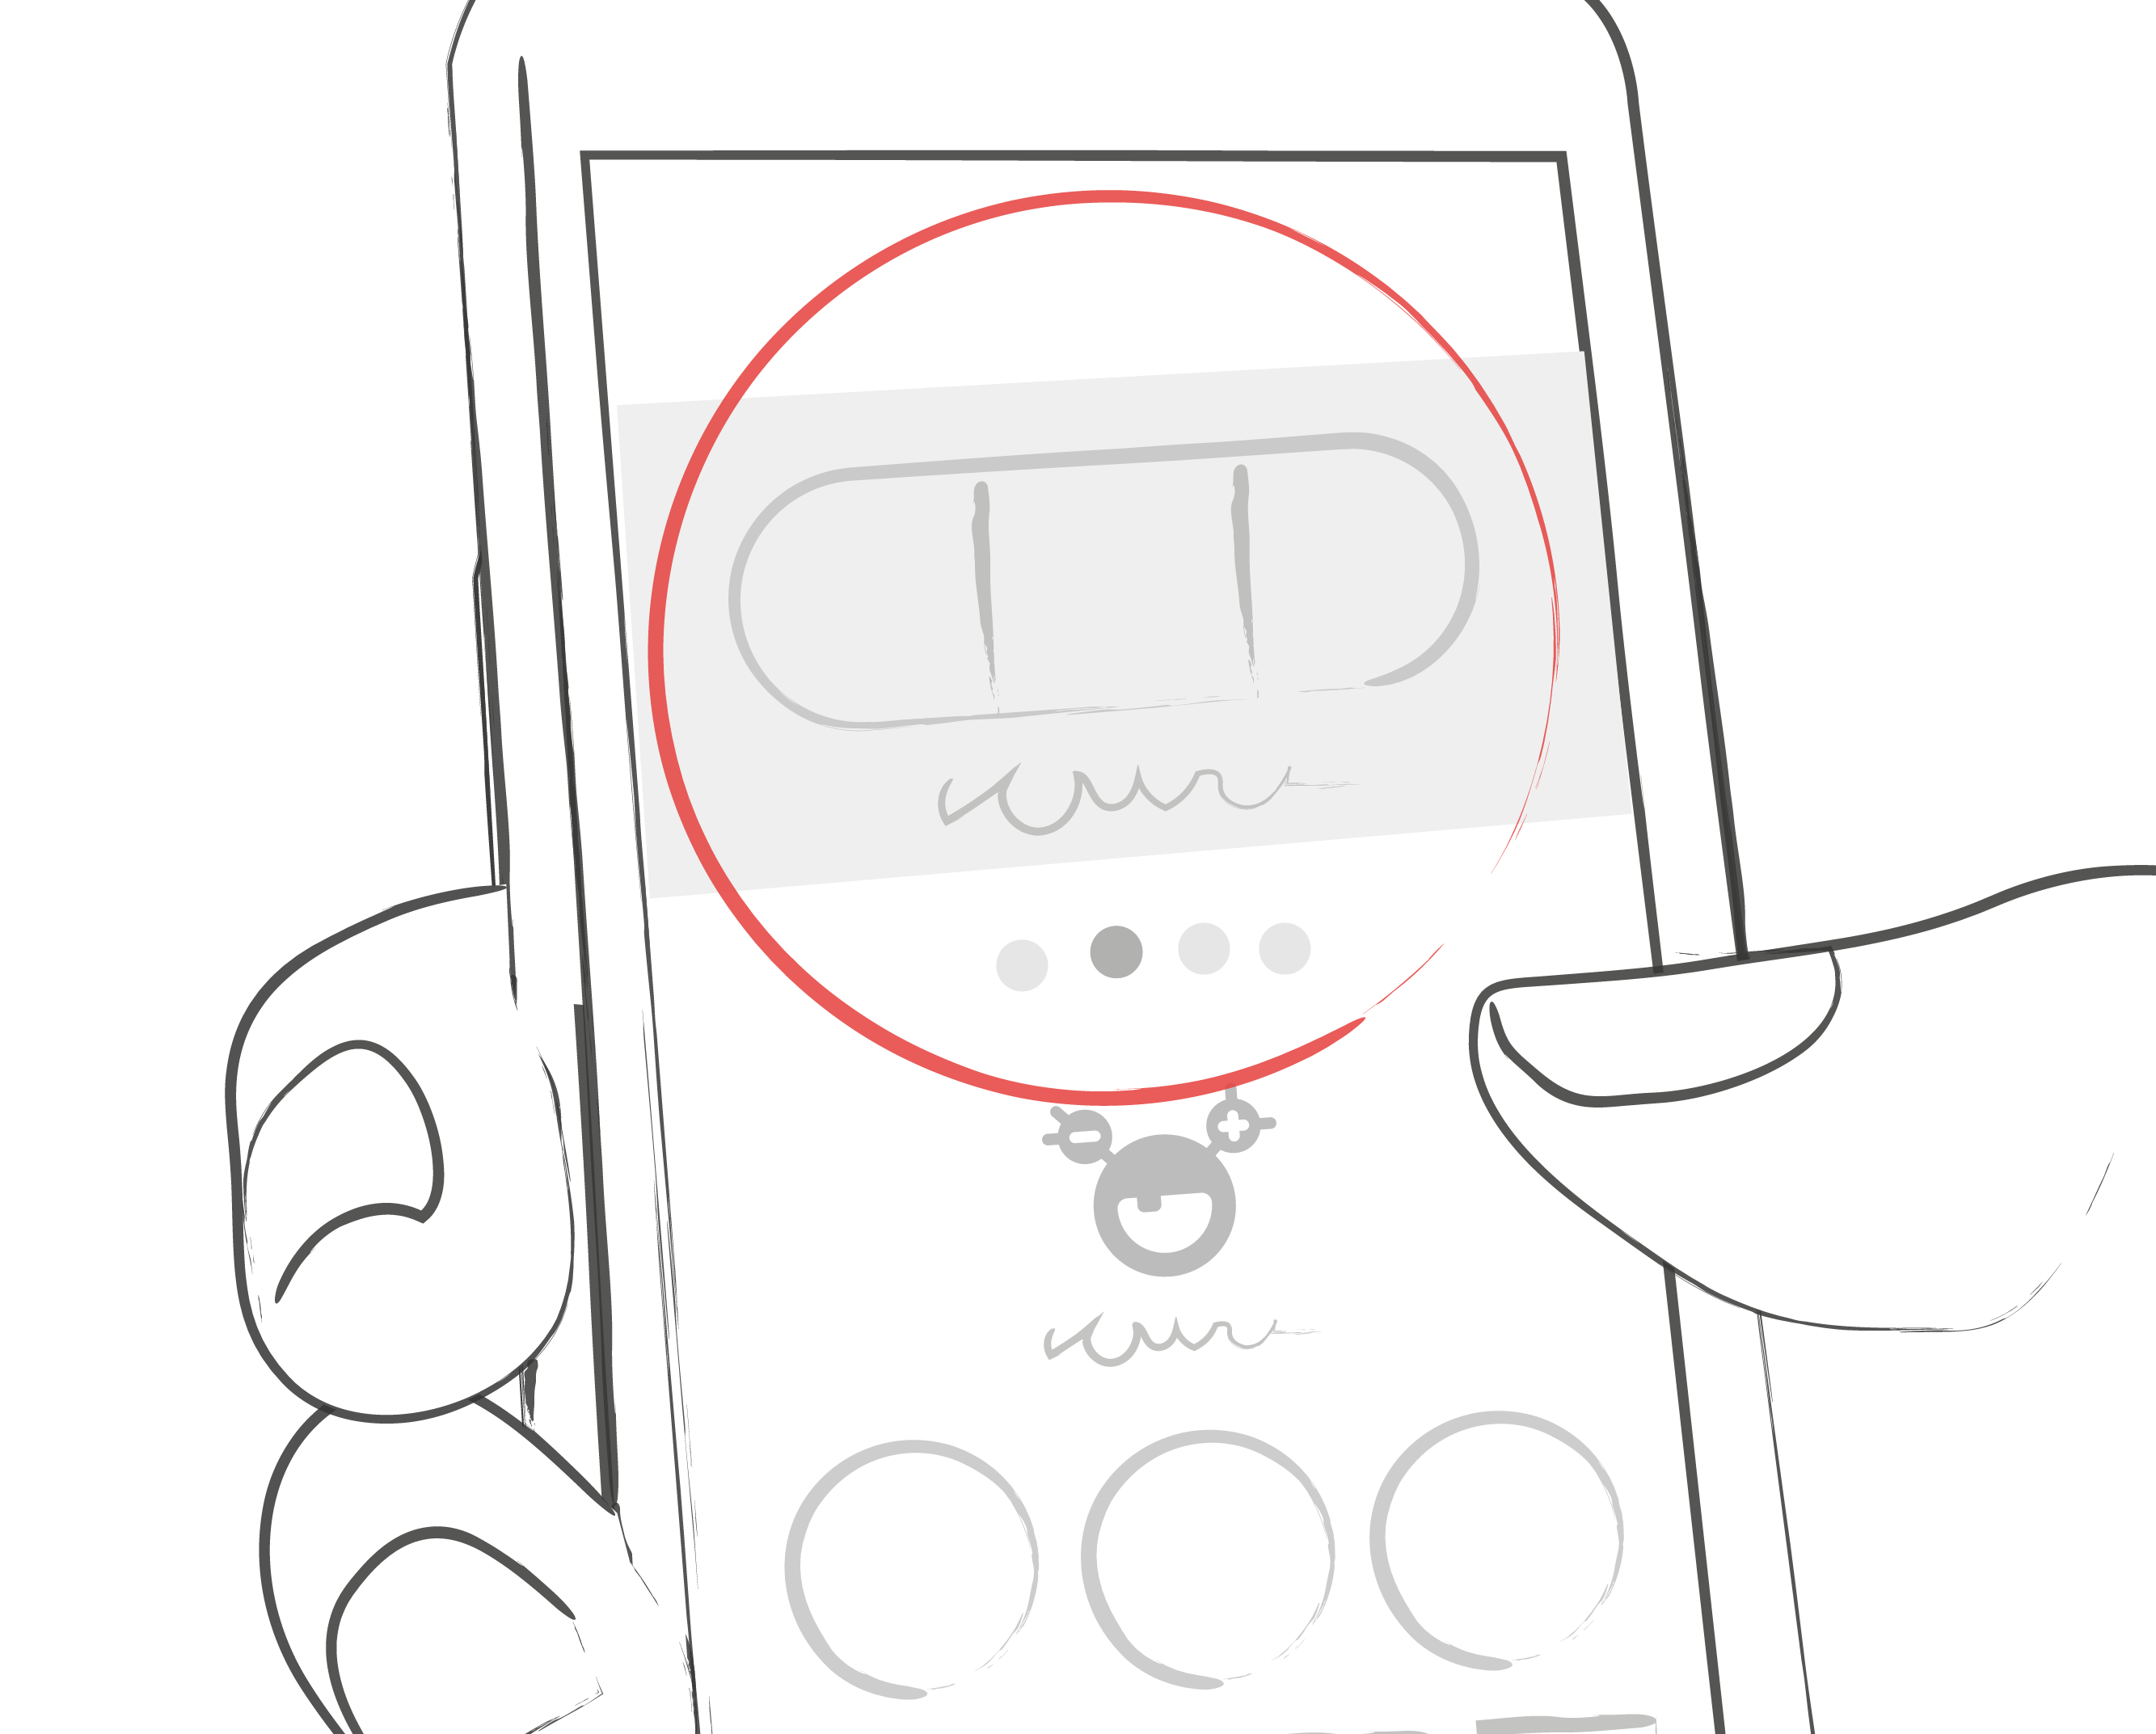
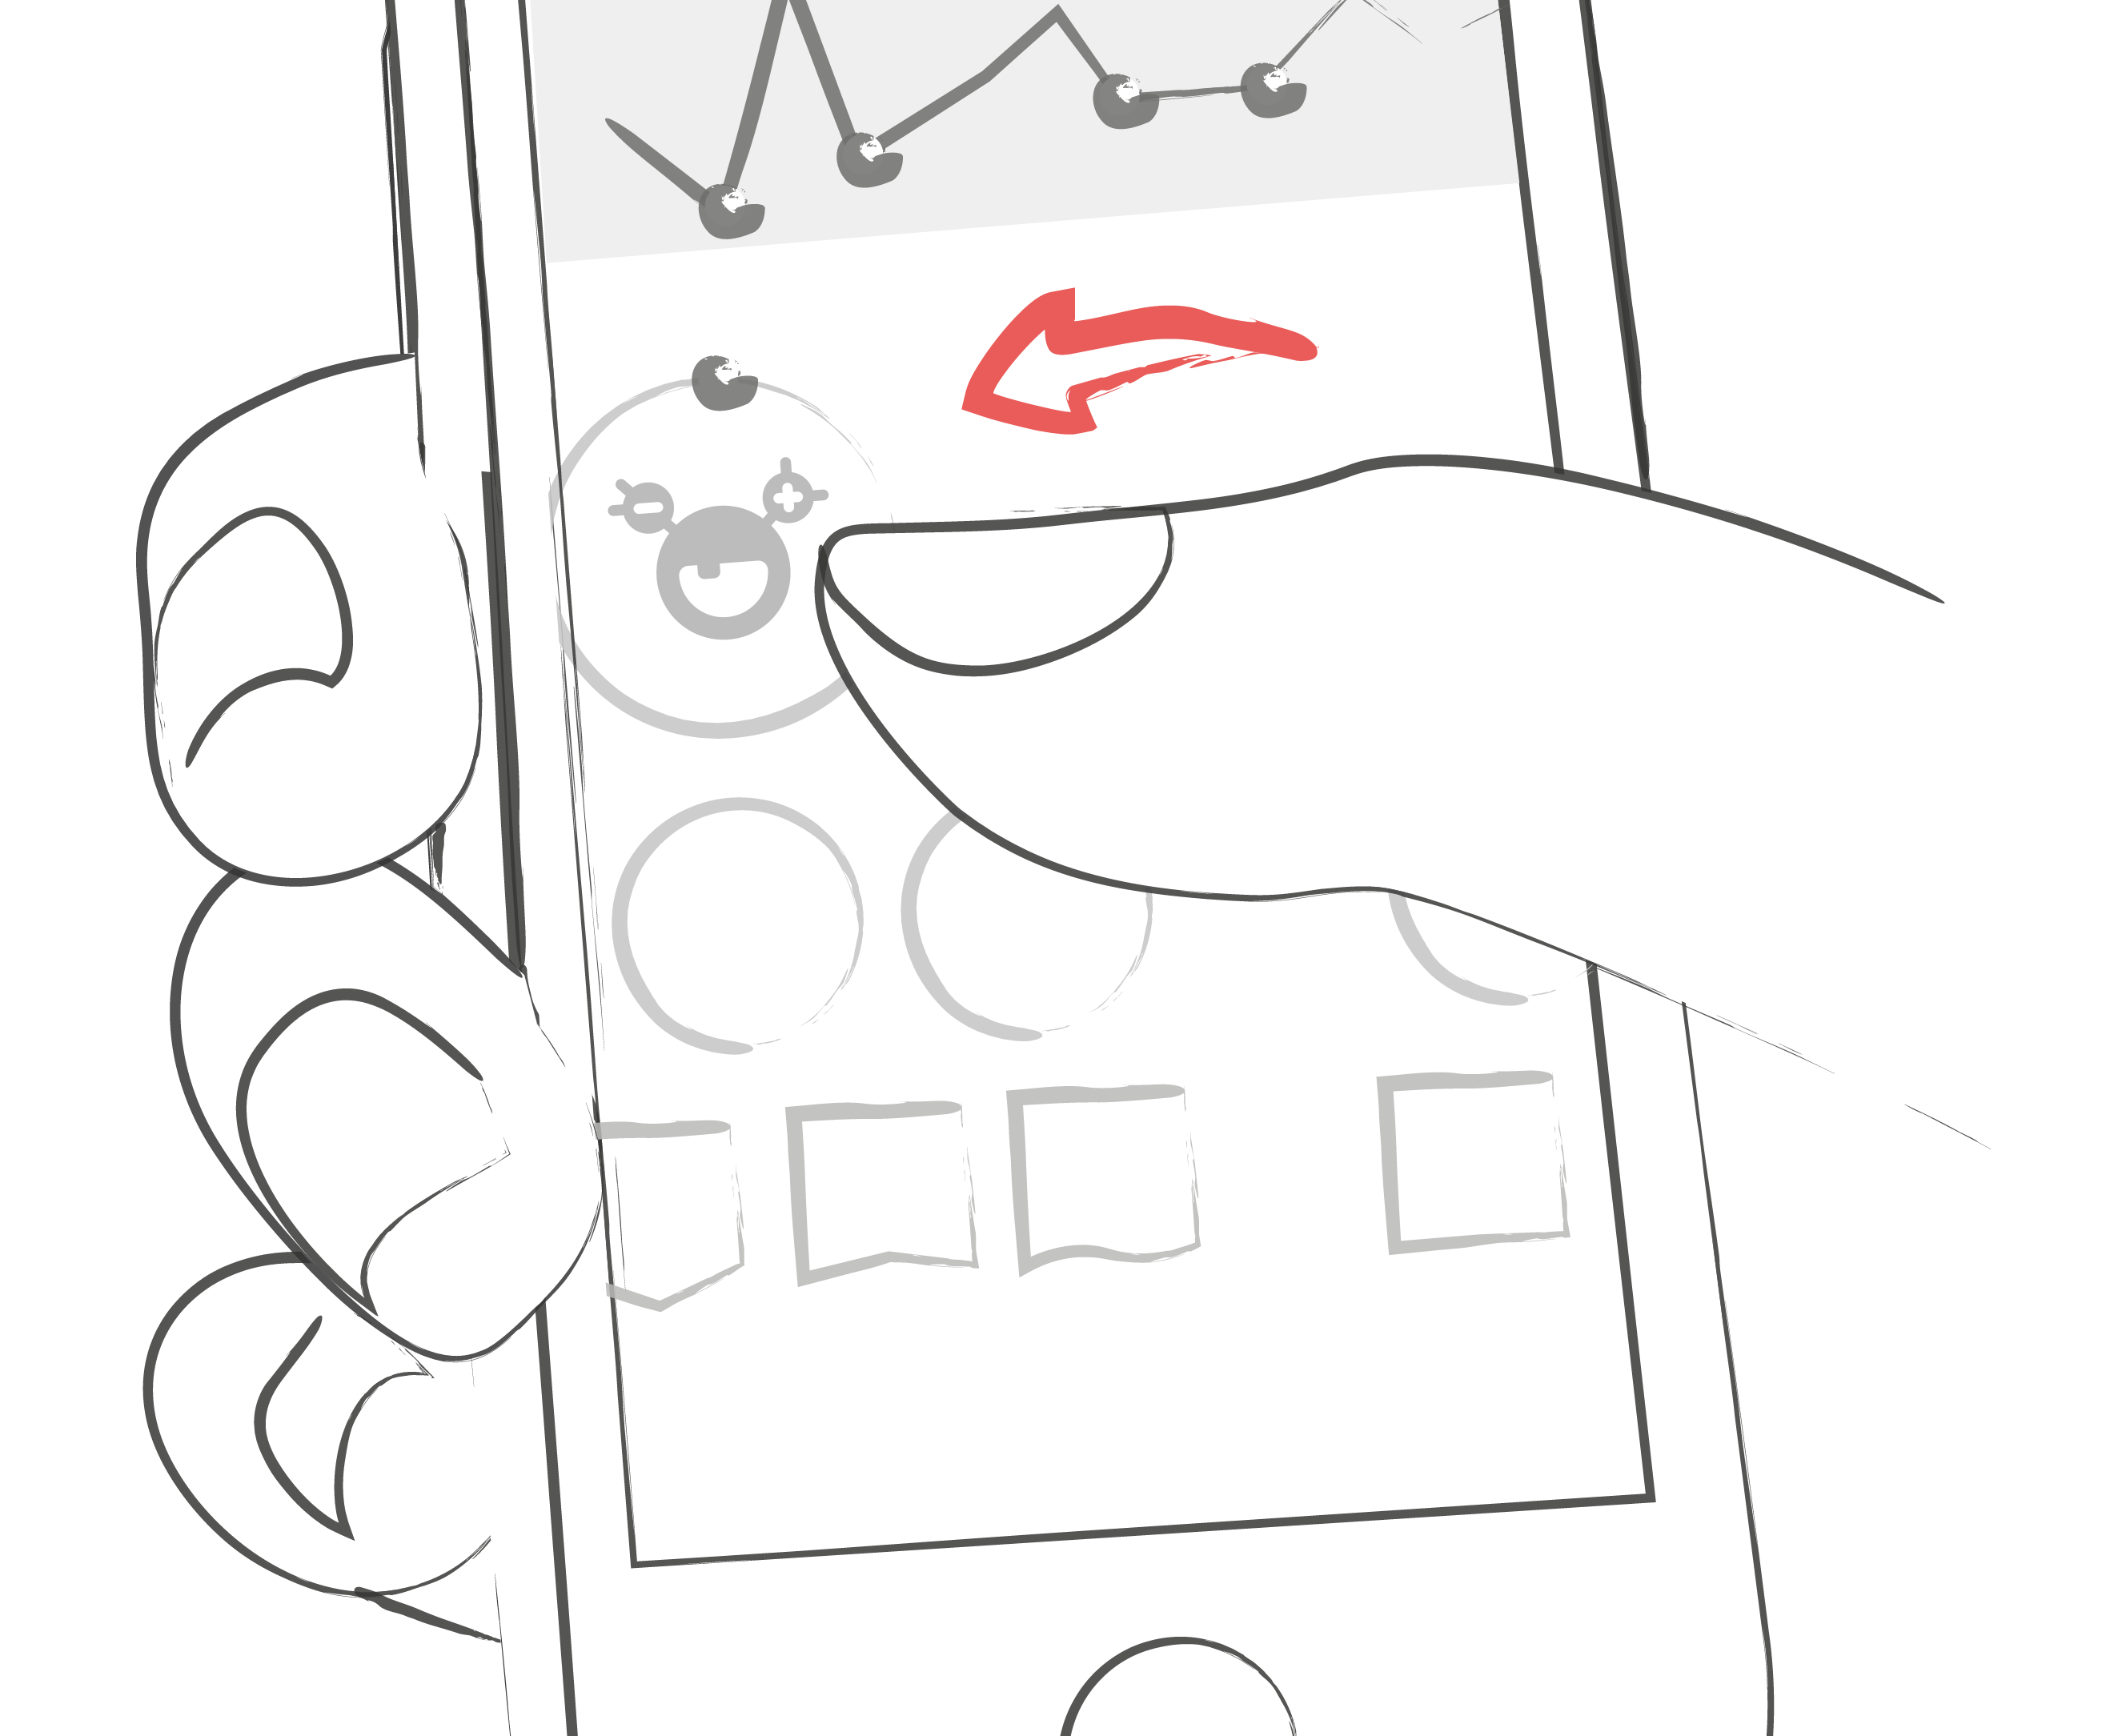
Swipe the daily overview to the left to get to analysis mode.
2
You'll get to the overview of the last 7 days. Swipe to the left again and enter the 14-day overview.
3
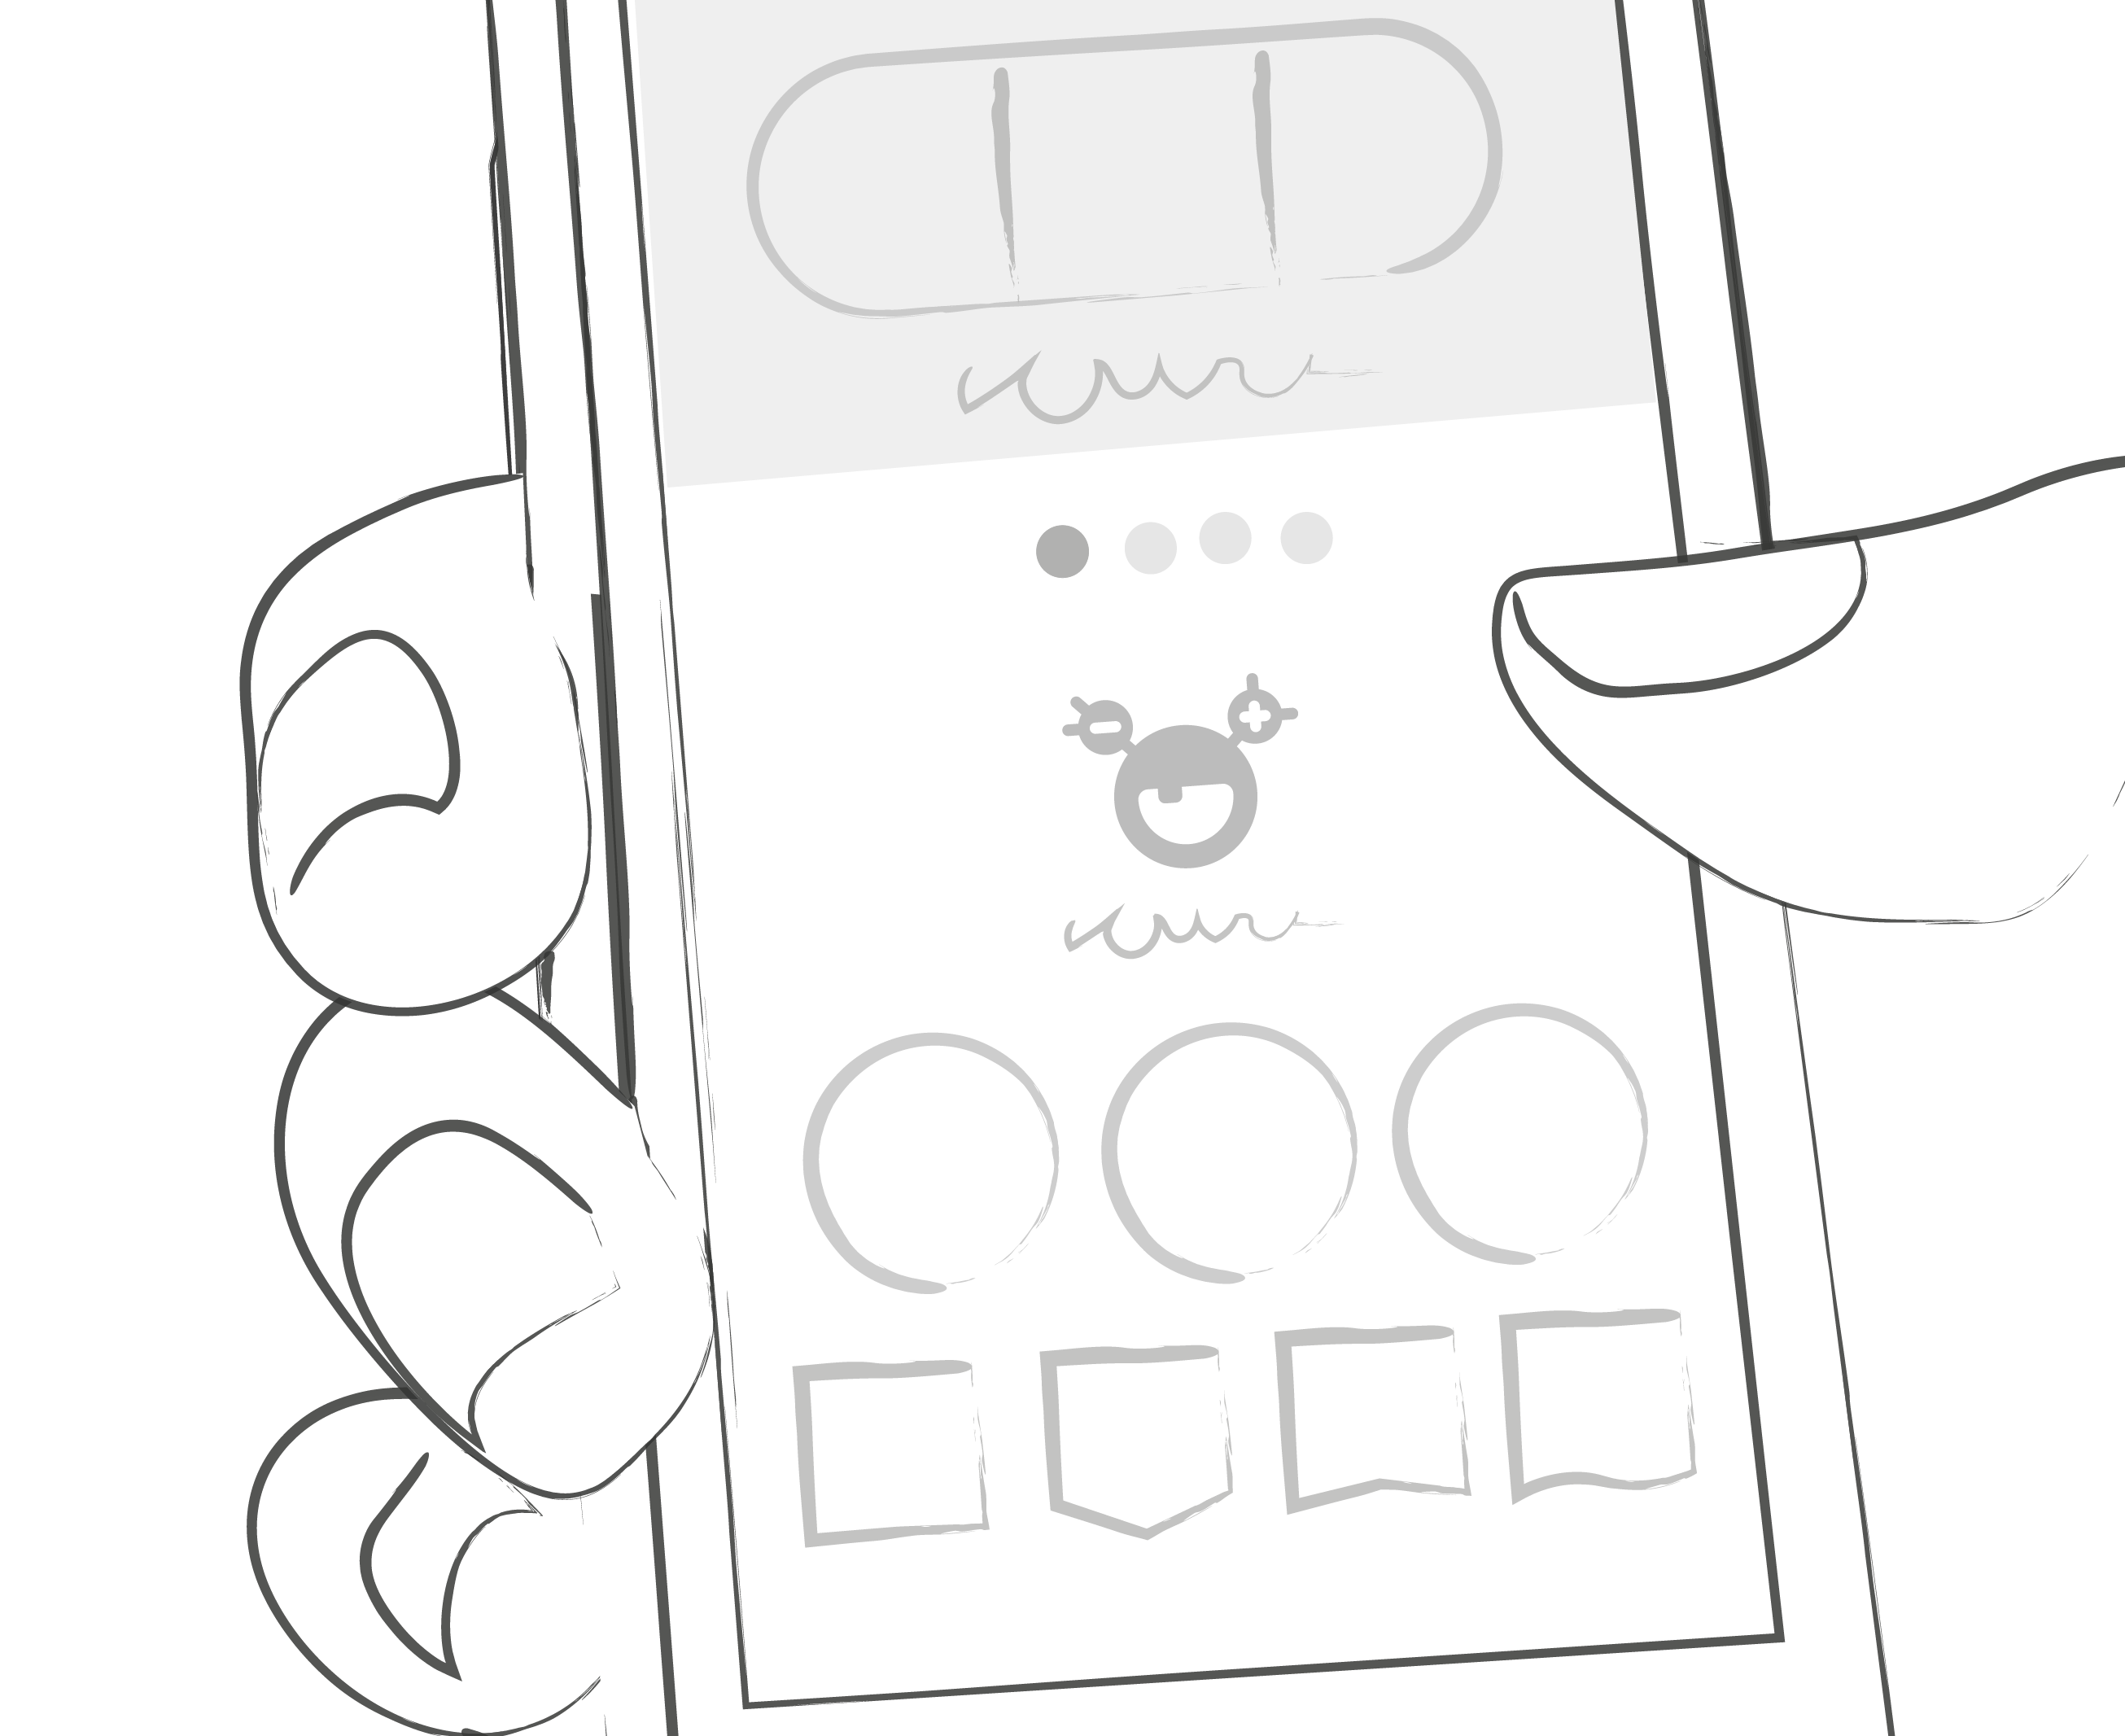
The dots show you where you are. Swipe left again and you'll get to your monthly overview and you'll even be able to see your quarterly overview!

4
Scroll down to see the graphs displaying past data!

5
The blue area shows your average amount of daily logs, your total amount of logs and how many points you've already collected.